The Profit/Loss Report in Prokip gives a complete summary of your business’s financial performance over a selected period.
It displays your gross profit, net profit, total income and expenses, and provides detailed profit analysis by product, category, brand, location, invoice, date, and customer.
This report helps you understand where your business earns and spends the most, so you can make better financial and sales decisions.
How to Access the Profit/Loss Report
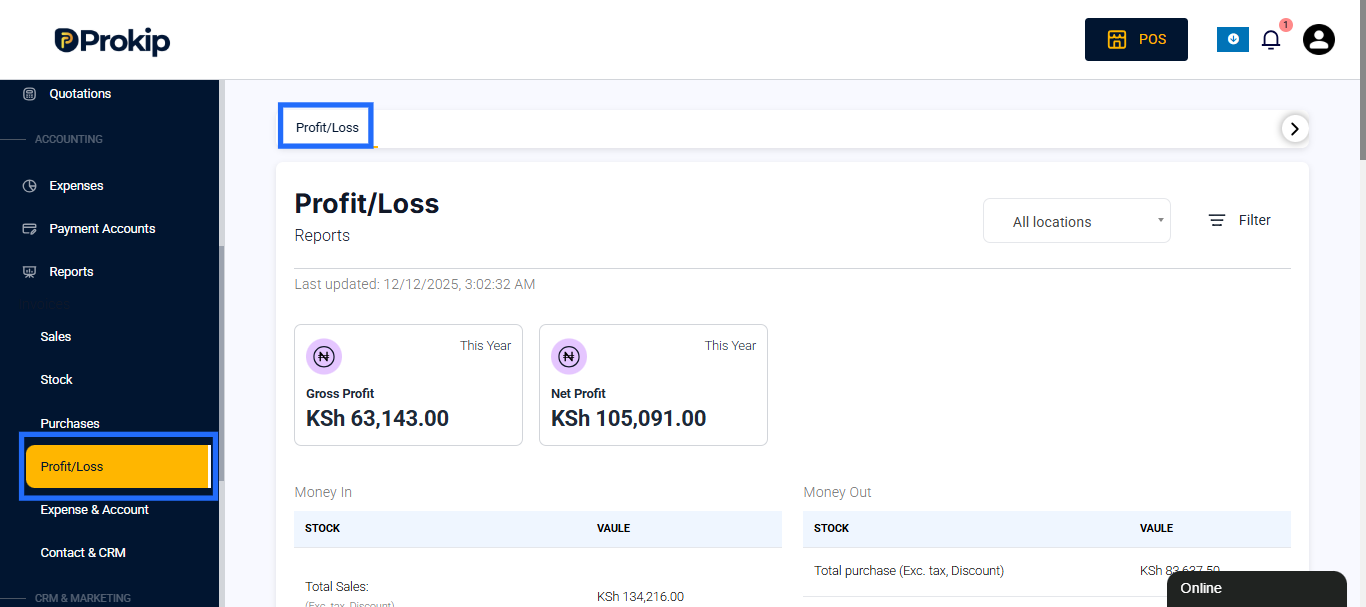
- From the main dashboard, go to Reports.
- Select Profit/Loss under the Reports section.
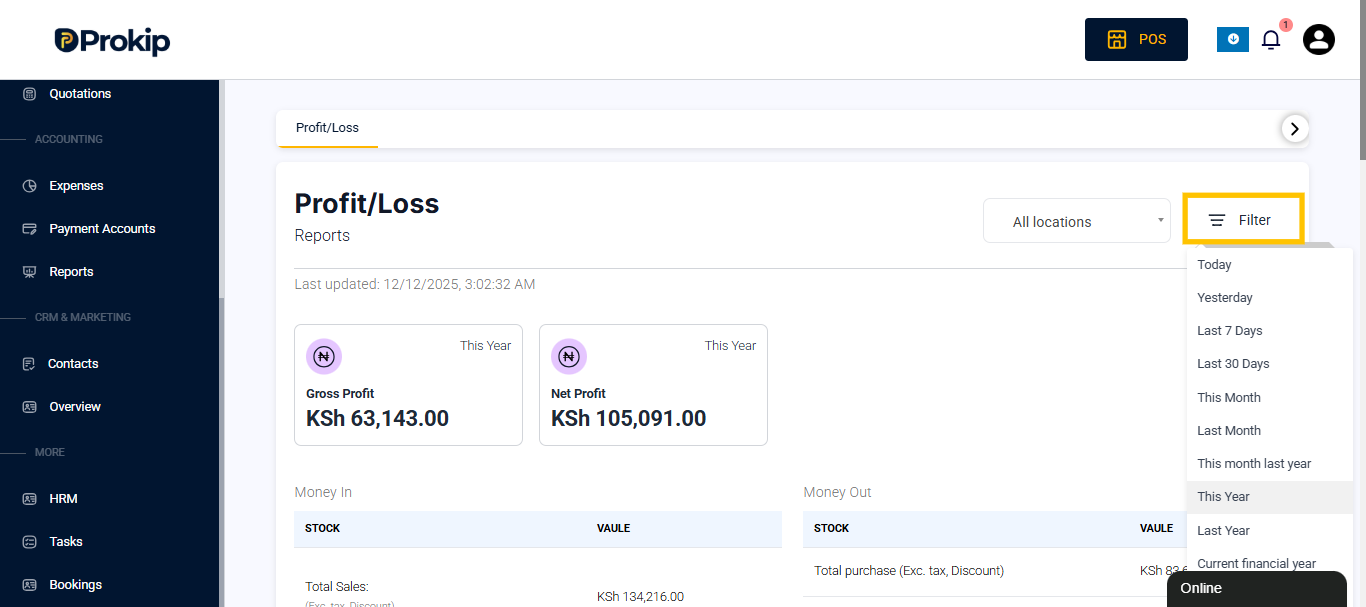
- Choose a date range using the filter options such as Today, This Month, This Year, or a Custom Range.
Report Overview
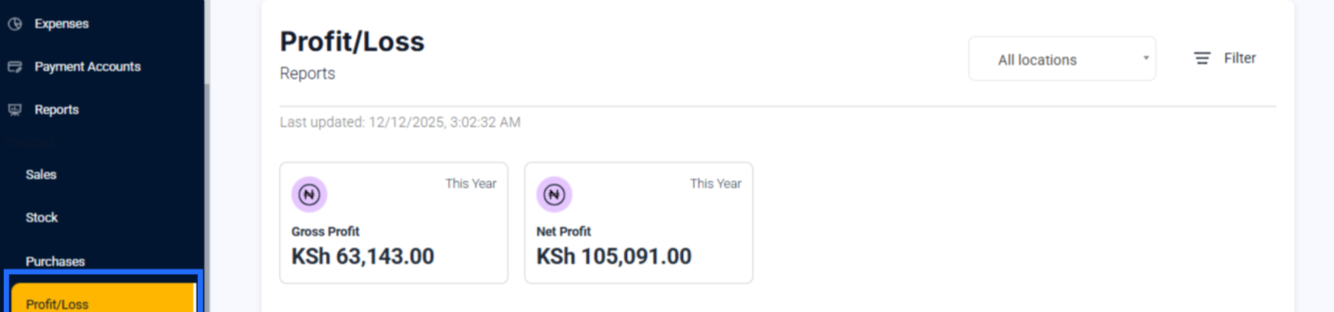
At the top of the page, Prokip displays two key performance indicators:
- Gross Profit – The total profit earned before deducting expenses (Sales minus Cost of Goods Sold).
- Net Profit – The actual profit after deducting all expenses, such as discounts, expenses, and payroll.
Example:
In a sample report, if:
- Gross Profit: KSh 91,750.00
- Net Profit: KSh 46,343.00
This means that after all business expenses are accounted for, the company earned a net income of KSh 46,343.00 for the selected period.
Money In Section
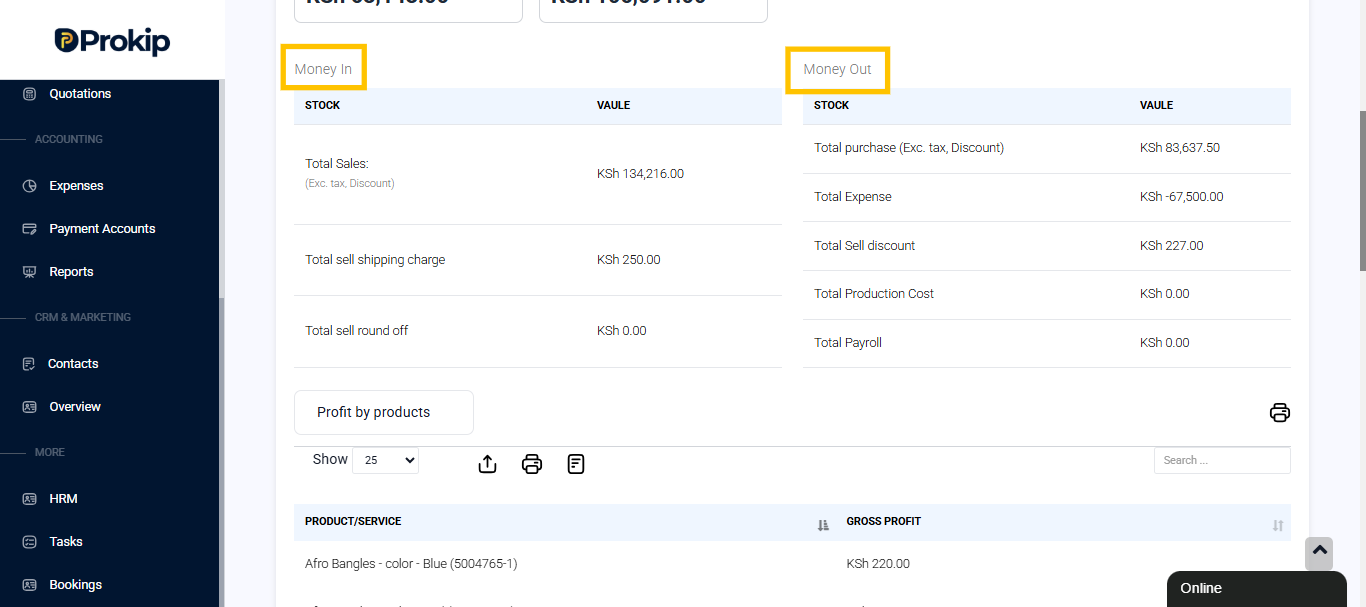
The Money In section shows the total incoming funds generated by the business, mainly through sales.
It includes:
- Total Sales (Exc. Tax, Discount): The total value of sales before applying tax and discounts.
- Total Sell Shipping Charge: The combined shipping fees added to sales.
- Total Sell Round Off: Any rounding adjustments made during sales..
Money Out Section
The Money Out section records all expenses and costs that reduce overall profit.
It includes both purchase costs and business expenses.
- Total Purchase (Exc. Tax, Discount): The total cost of goods bought.
- Total Expense: Any additional operating expenses like rent, utilities, or maintenance.
- Total Sell Discount: The total discounts offered to customers.
- Total Production Cost: The total spent on manufacturing or production (if applicable).
- Total Payroll: The total salaries and wages paid during the period.
These figures are used to calculate your Net Profit after deducting all outflows.
Profit Breakdown Filters
The Profit/Loss Report includes detailed filters that allow you to view profit based on different parameters.
You can analyze profits from multiple perspectives to get deeper insights into performance.
Available breakdown options include:
- Profit by Products: Displays profit for each product or service sold.
- Profit by Categories: Shows profit grouped by product categories (e.g., Clothing, Cosmetics, Accessories).
- Profit by Brands: Displays profit earned by each brand you sell.
- Profit by Location: Useful for multi-location businesses — compares profit from each business branch.
- Profit by Invoice: Displays profit per sales invoice, helping track performance by individual transactions.
- Profit by Date: Summarizes daily, weekly, or monthly profit trends.
- Profit by Customer: Shows which customers contribute most to your profits.
- Profit by Day: Gives a daily view of profits over a selected date range.
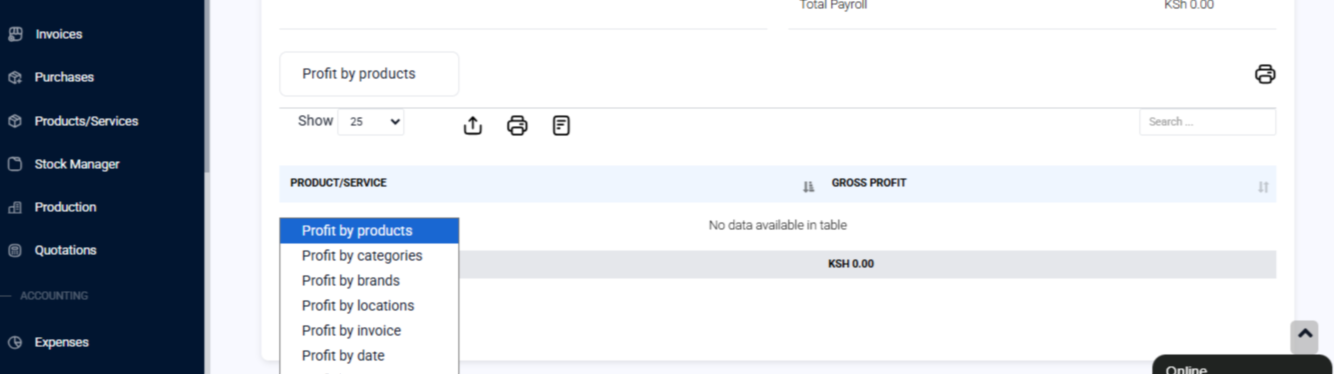
These breakdowns make it easier to identify which products, customers, or locations are most profitable and where improvements are needed.
How Businesses Use the Profit/Loss Report
The Profit/Loss Report is a powerful tool for financial planning and performance tracking.
Businesses use it to:
- Measure gross and net profitability.
- Identify high-performing and low-performing products.
- Evaluate operational costs and profit margins.
- Compare sales income versus expenses over time.
- Support financial reporting, accounting, and decision-making.