The Expense Report in Prokip provides a detailed summary of all business expenditures within a selected time period. It helps users monitor where money is being spent and identify key cost areas such as payroll, entertainment, or other operational expenses.
How to Access the Expense Report
To access the Expense Report:
- Go to the Dashboard.
- Click on Reports.
- Select Expense from the available report categories.
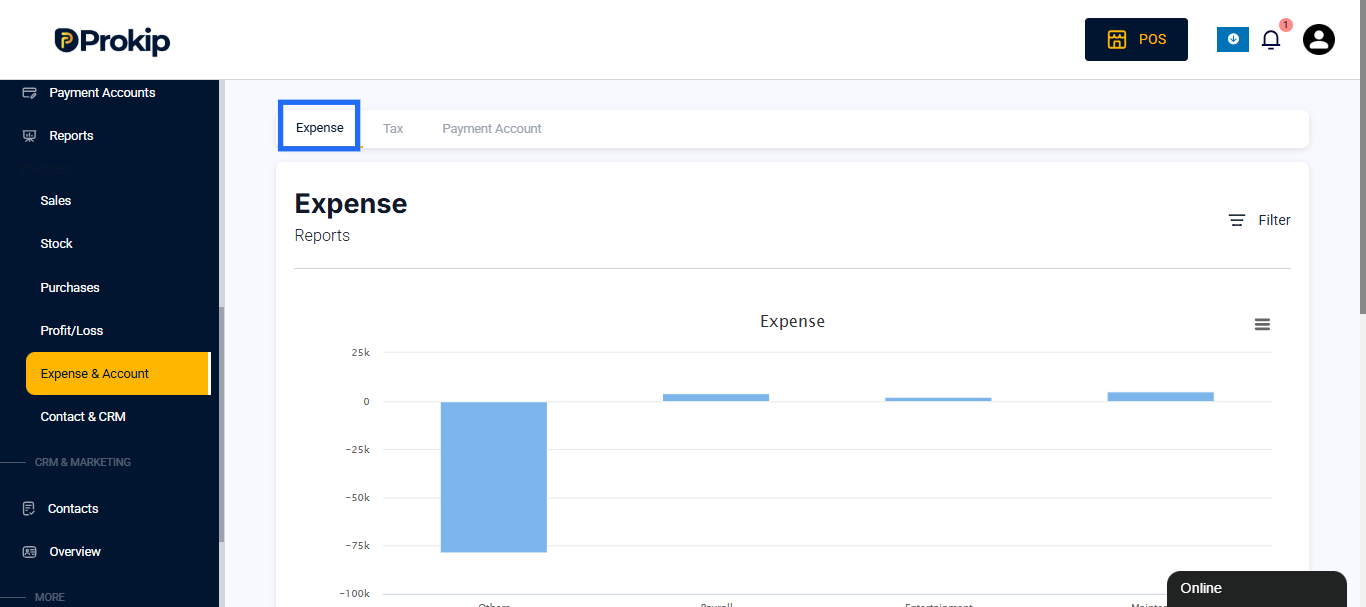
Once opened, the page displays a summary of your total expenses along with a visual chart that shows the distribution of costs by category.
Filters
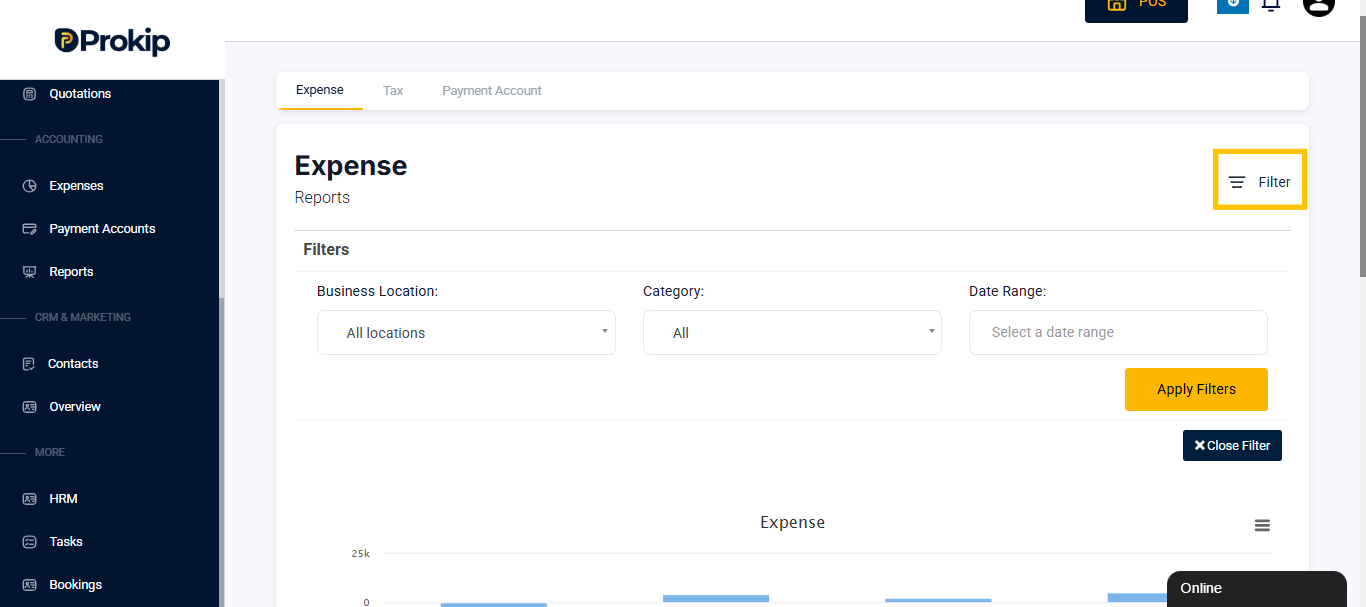
The Expense Report includes several filter options that allow users to narrow down results and analyze data within specific contexts.
You can filter expenses using the following parameters:
- Business Location – View expenses by specific branches or locations.
- Category – Filter based on expense type, such as payroll, utilities, or entertainment.
- Date Range – Select a predefined or custom date range to review expenses for a specific period.
Expense Overview
The Expense Overview section provides a quick visualization of how expenses are distributed across categories.
A bar chart appears at the center of the page, clearly showing the proportion of total expenses attributed to each category.
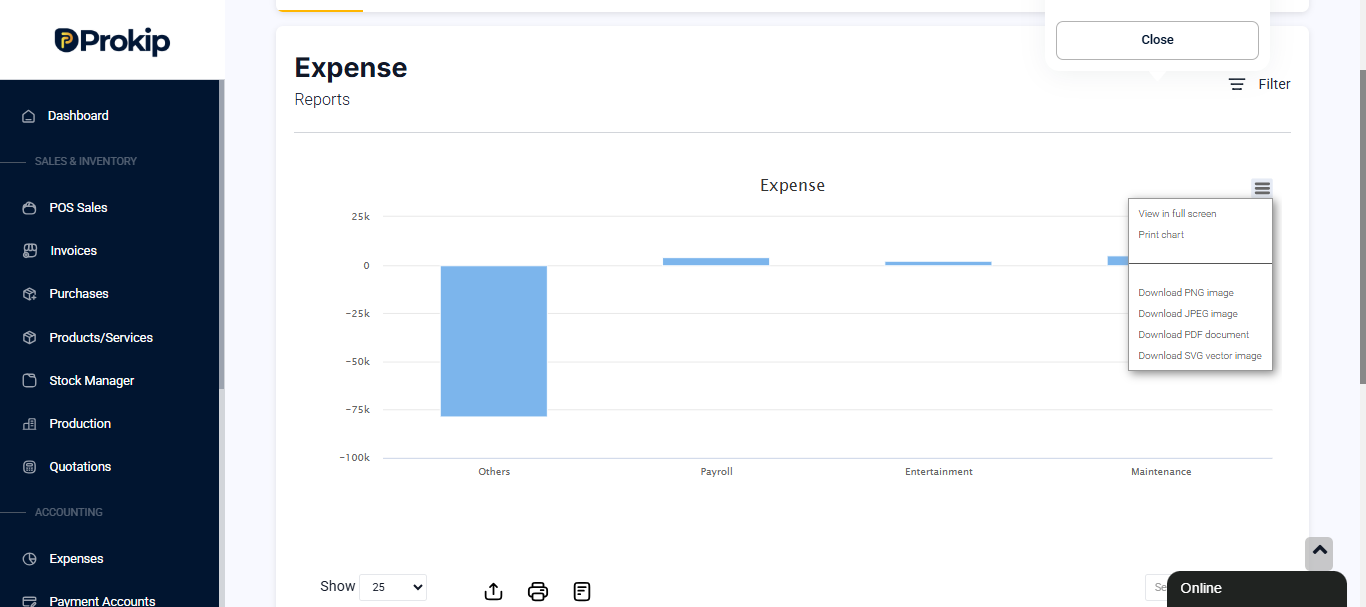
The chart gives an immediate snapshot of spending trends. For example, it might show that most expenses are in the “Others” category, followed by “Payroll” and “Entertainment.”
This helps users instantly identify major spending areas and assess cost control measures.
Expense Breakdown
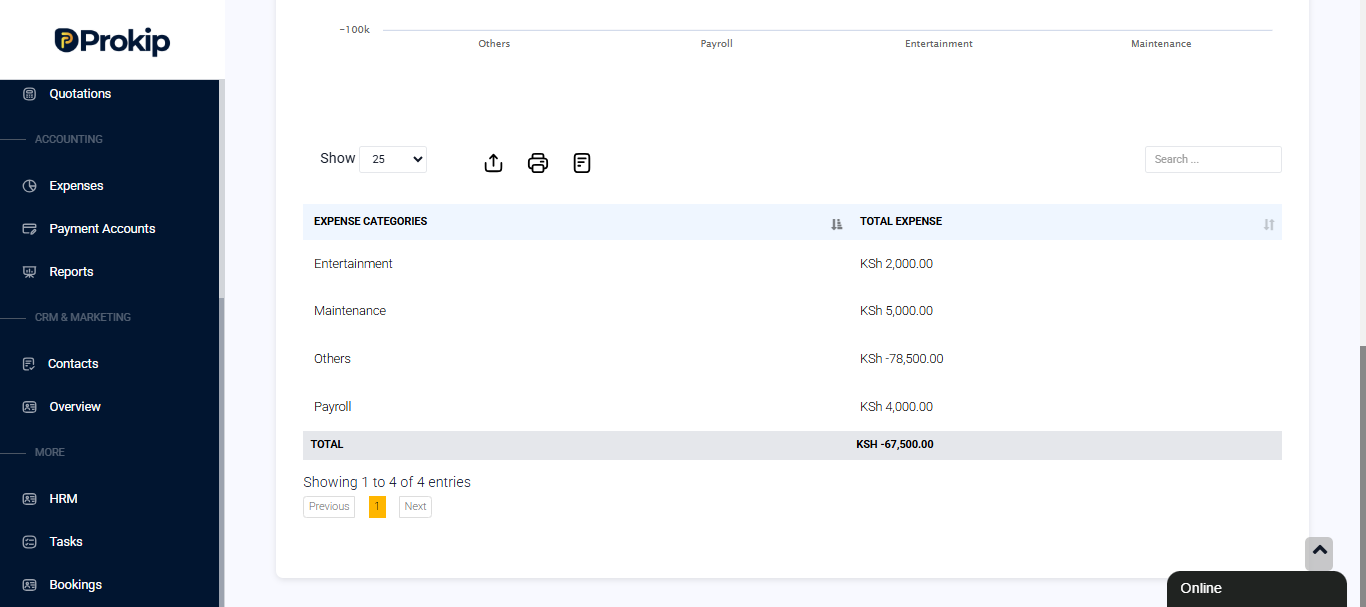
Below the chart, a summary of all expenses is displayed.
Each category is listed alongside its total cost in KSh, providing a clear financial picture of your organization’s outflows.
An example view might include:
- Entertainment expenses
- Other operational expenses
- Payroll costs
- A total amount summing all listed categories
Purpose and Use
The Expense Report serves as a key financial management tool for:
- Tracking total business expenditures over time.
- Understanding where company resources are allocated.
- Comparing costs across categories and locations.
- Supporting decision-making on budgeting and cost reduction.
By using filters and reviewing the expense breakdown regularly, business owners can gain better insight into operational efficiency and maintain tighter control over financial performance.