The Top Products Report in Prokip gives you a clear visual summary of your best-performing products.
Instead of listing them in a table, this report presents your top-selling products in a bar chart, making it easy to quickly identify which items are driving the most sales over a selected period.
How to Access the Top Products Report
- Log in to your Prokip Dashboard.
- From the left-hand menu, go to Reports.
- Click on Sales & Scroll to the Top Products tab.
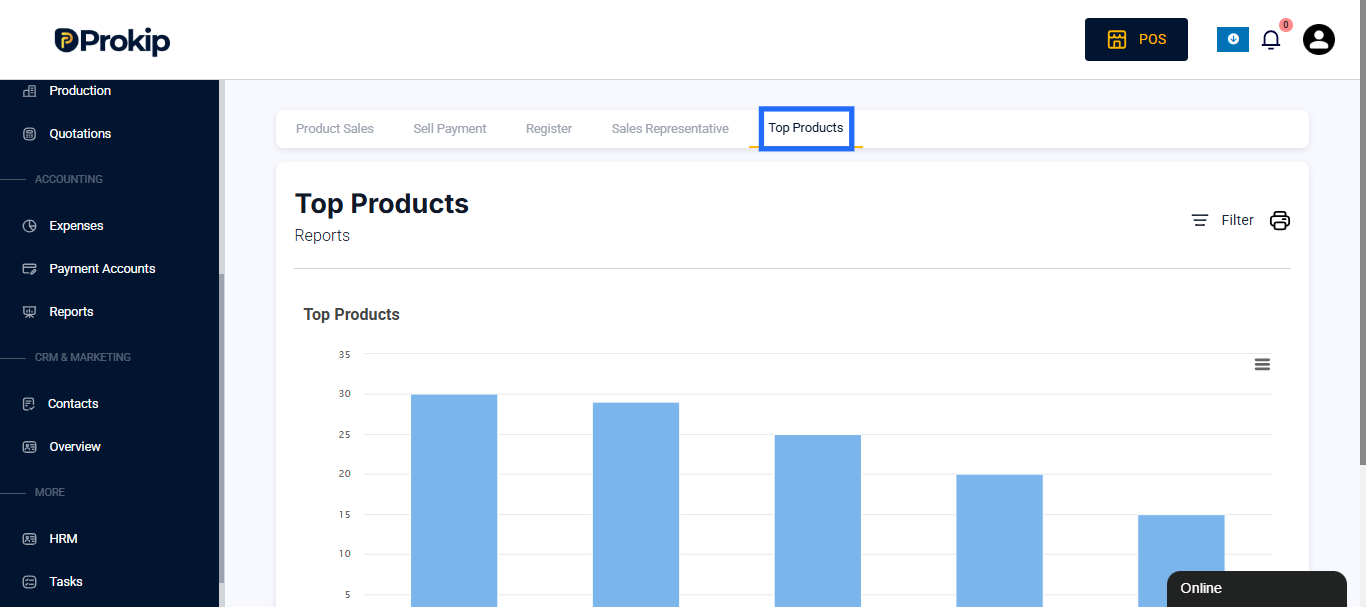
(Screenshot: Show where “Top Products” appears in the Reports menu.)
Using Filters
You can narrow down or customize your chart view using the available filters:
- Business Location: Select which branch or shop’s performance you want to review.
- Category: Filter by product category (e.g., Skincare, Clothing, Electronics).
- Subcategory: View only specific product subgroups.
- Brand: Focus on a particular brand’s sales performance.
- Unit: Select the measurement type (e.g., pieces, cartons, liters).
- Date Range: Choose the period to analyze — daily, weekly, monthly, or custom.
- Number of Products: Define how many top products you want displayed (e.g., Top 5, Top 10).
- Product Type: Select Top Products to generate the chart.
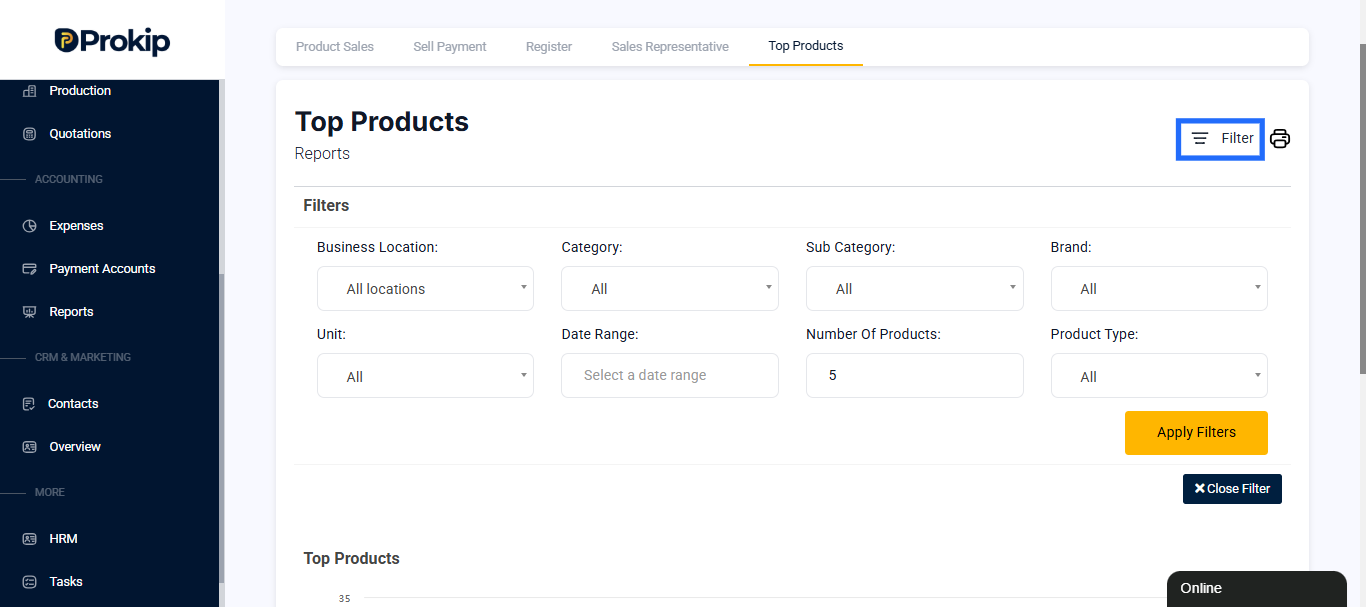
Chart Display
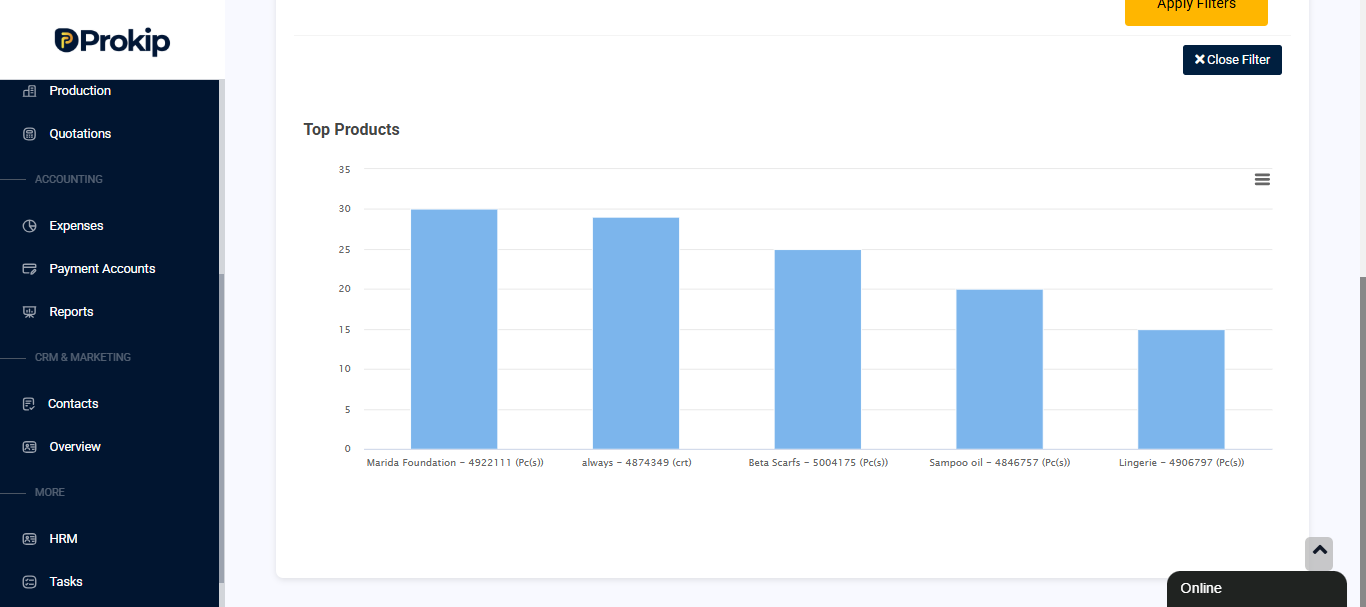
Once filters are applied, Prokip automatically generates a bar chart that visually represents your top products based on the total units sold.
Each bar represents a product and includes:
- Product Name – The item name.
- Product SKU – The unique product identifier.
- Sales Unit – The unit of measure (e.g., pcs, crt, kg)..
The height of each bar shows the relative performance — taller bars indicate higher sales volumes.
How to Read the Chart
- X-Axis (Horizontal): Displays product names and codes.
- Y-Axis (Vertical): Shows the number of units sold.
- Blue Bars: Represent the total quantity sold for each product.
This layout provides a quick visual comparison between different products’ performances.
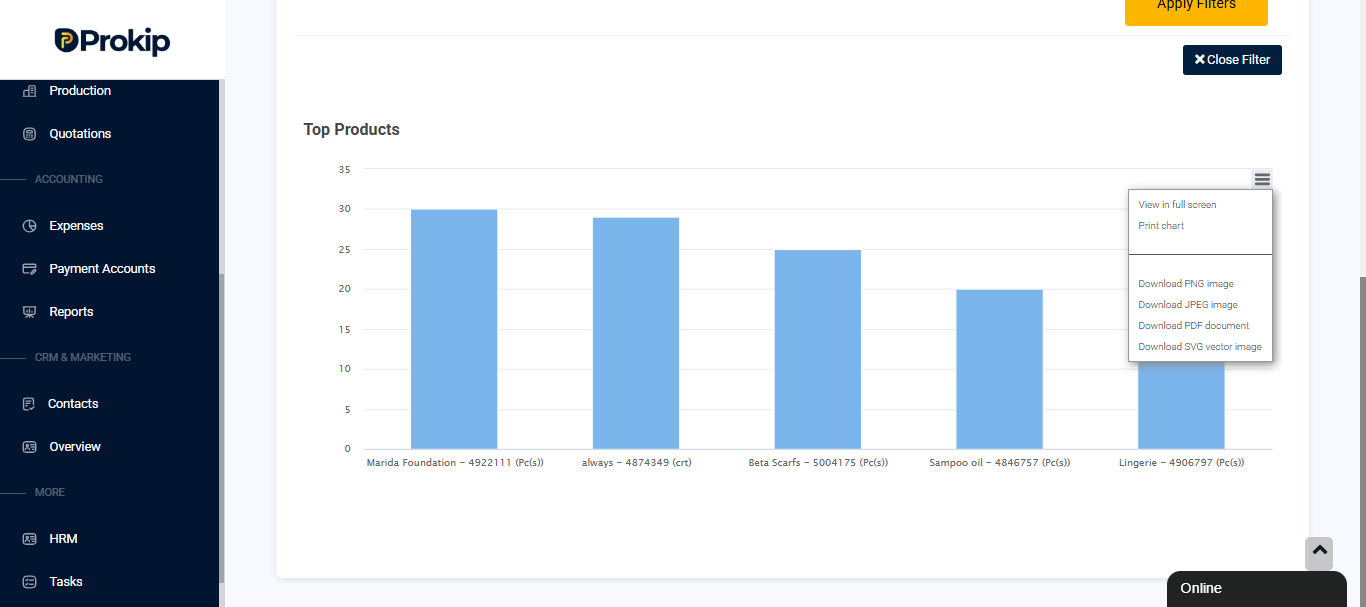
You can also download the report for analysis.
How This Report Helps
- Quickly Identify Bestsellers: Instantly see your highest-selling products.
- Simplify Analysis: The chart gives a clear visual overview without needing to read large tables.
- Guide Stocking Decisions: Focus inventory on fast-moving products.
- Plan Promotions: Use insights to promote or restock high-demand items.
- Monitor Brand Performance: Compare how brands or categories perform across locations.
Best Practices
- Review this report weekly or monthly to track changing sales patterns.
- Adjust your stock levels or marketing campaigns based on visual performance trends.
- Export screenshots of the chart for meetings or presentations.
- Compare different time ranges to see growth or decline trends.
Related Reports
- Sales Report Click here – For detailed transaction breakdowns.
- Sales Representative Report Click here – For individual sales performance.
- Sell Payment Report Click here – For payment tracking and summaries.